Work Case Study Impact Discuss a project
← All case studies
06 · CASE STUDY · RENAULT

Predictive Vehicle Quality& Warranty Analytics.

Turning fragmented vehicle, incident and diagnostic data into governed defect intelligence for earlier risk detection and warranty decision support.

Mandate: lead the end-to-end Data / Product lifecycle for a predictive analytics application combining data modelling, governance, forecasting, operational BI and user workflows.
AutomotiveVehicle QualityData ProductProgram ManagementProject Management
Data ManagementData PipelineData GovernanceBusiness IntelligencePredictive Analytics
AI / Machine LearningWarranty RiskRisk ManagementISO/IEC 27001
Predictive vehicle-quality flow from governed data to warranty decisions
ROLE / MANDATEData Analytics Engineer · Product Owner · Project Manager

End-to-end contribution across data, product, analytics, application design and operational delivery.

SituationFragmented vehicle-quality evidence

Vehicle definitions, customer symptoms, diagnostic files, ECU context and corrective actions lived across heterogeneous systems.

Product directionPredictive quality intelligence

A governed analytical product designed to connect historical evidence with a forward-looking nine-month risk horizon.

Decision outcomeEarlier visibility. Better prioritisation.

Quality and warranty teams gained a structured path from fleet signals to defect investigation and corrective action.

01 · VEHICLE QUALITY CHALLENGE

Make fragmented field evidence decision-ready.

The challenge was not to produce another dashboard. It was to create a trustworthy analytical chain connecting the active fleet, customer symptoms, diagnostic evidence and corrective-action history.

From retrospective reporting to earlier quality-risk anticipation.

Vehicle-quality analysis depended on poorly structured, incomplete and redundant data across multiple operational systems. Source structures varied, documentation was inconsistent and relationships between a vehicle population, a customer symptom, a diagnostic code and a corrective action were difficult to trace.

The mandate combined data-product design and delivery: structure the domain model, establish governed definitions, integrate cross-source evidence, formalise analytical treatments and translate the result into a usable operational application.
Data complexity

Heterogeneous source structures

Vehicle, incident, diagnostic and engineering evidence required common keys, controlled mappings and consistent time logic.

Analytical complexity

Signal → contributor → defect

Users needed to move from a fleet-level symptom rate to product contributors, diagnostic codes and underlying cases.

Operational complexity

Insight had to lead to action

Forecasts and Pareto views had to support investigation, prioritisation, evidence export and corrective-action follow-up.

02 · PRODUCT VISION

One governed path from vehicle data to quality decisions.

The product vision connected four layers that had previously been treated separately: operational evidence, trusted integration, predictive analytics and decision workflows.

01Evidence

Vehicle & quality data

Fleet configuration, customer symptoms, diagnostic files, ECU context and corrective-action history.

02Foundation

Governed data model

Controlled perimeters, groupings, source relationships, calculation rules, traceability and shared definitions.

03Intelligence

Predictive analytics

Symptom and defect rates, contribution analysis, Pareto prioritisation and forward-looking risk signals.

04Action

Operational decisions

Drill-down investigation, defect alerts, corrective-action review and quality / warranty prioritisation.

03 · DATA ARCHITECTURE

A two-level story: executive clarity with technical depth.

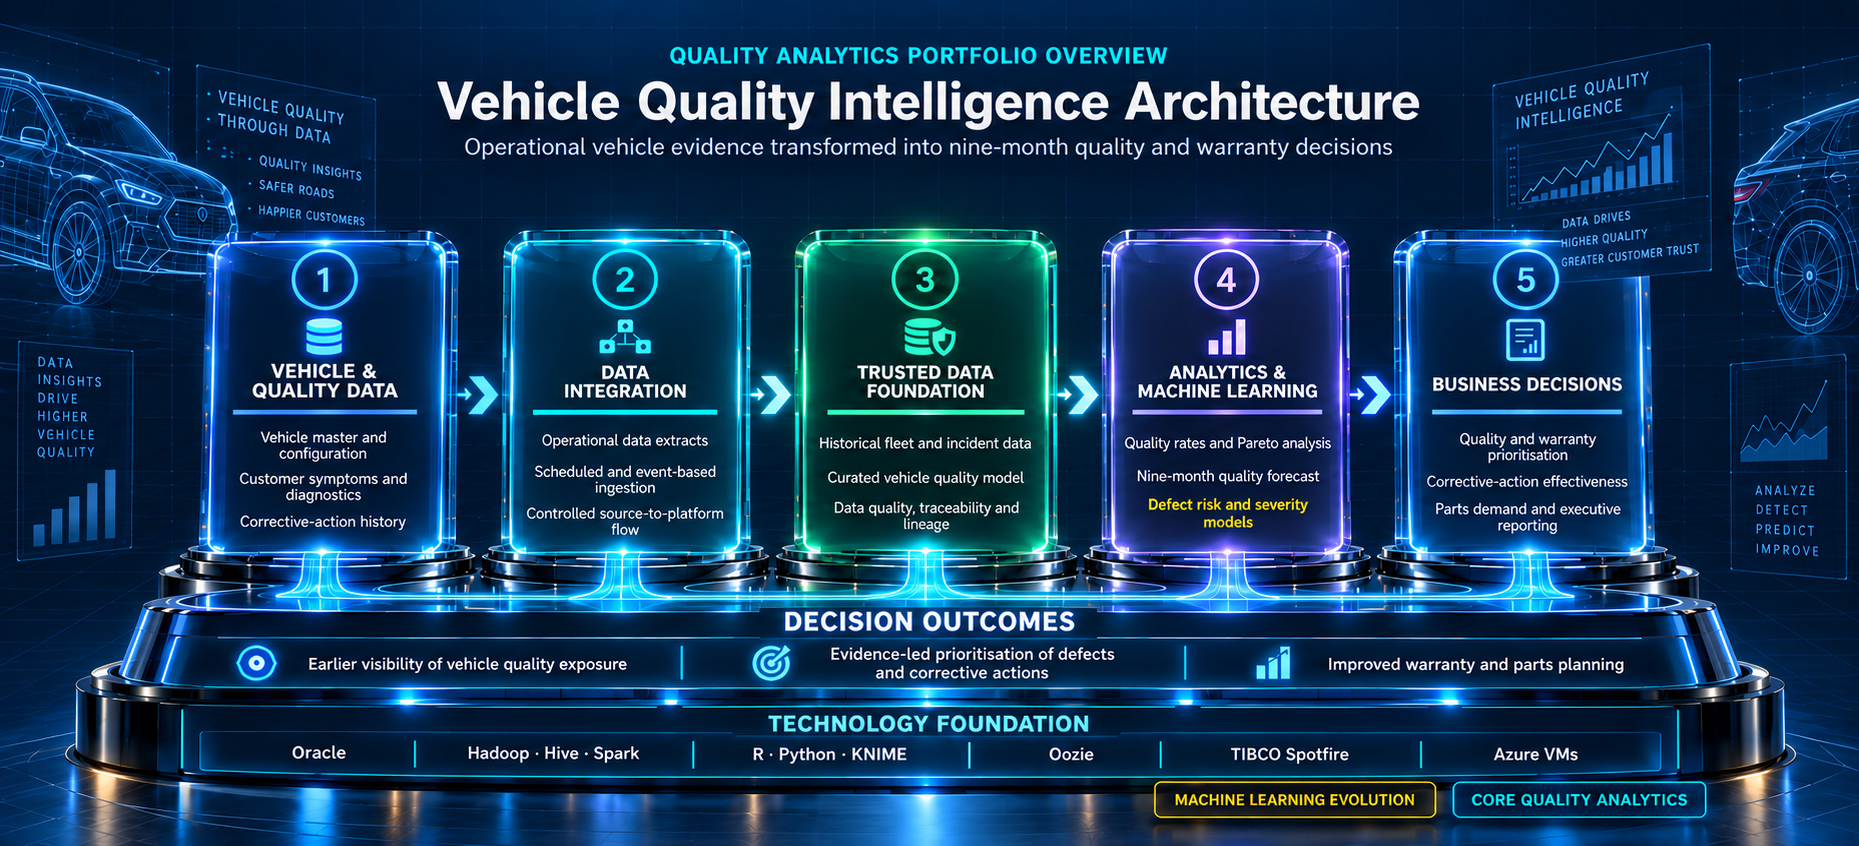
The public portfolio view communicates the operating logic in five stages. The detailed technical reconstruction remains available as supporting evidence without exposing confidential source-system mappings.

Vehicle Quality Intelligence Architecture — portfolio overview
Vehicle Quality Intelligence ArchitectureOperational vehicle evidence moves through controlled integration and a trusted foundation into analytics, machine learning and business decisions.
Vehicle dataData integrationTrusted foundationAnalytics & MLBusiness decisions
04 · GOVERNED DATA PIPELINE

Traceable data. Predictive intelligence. Continuous improvement.

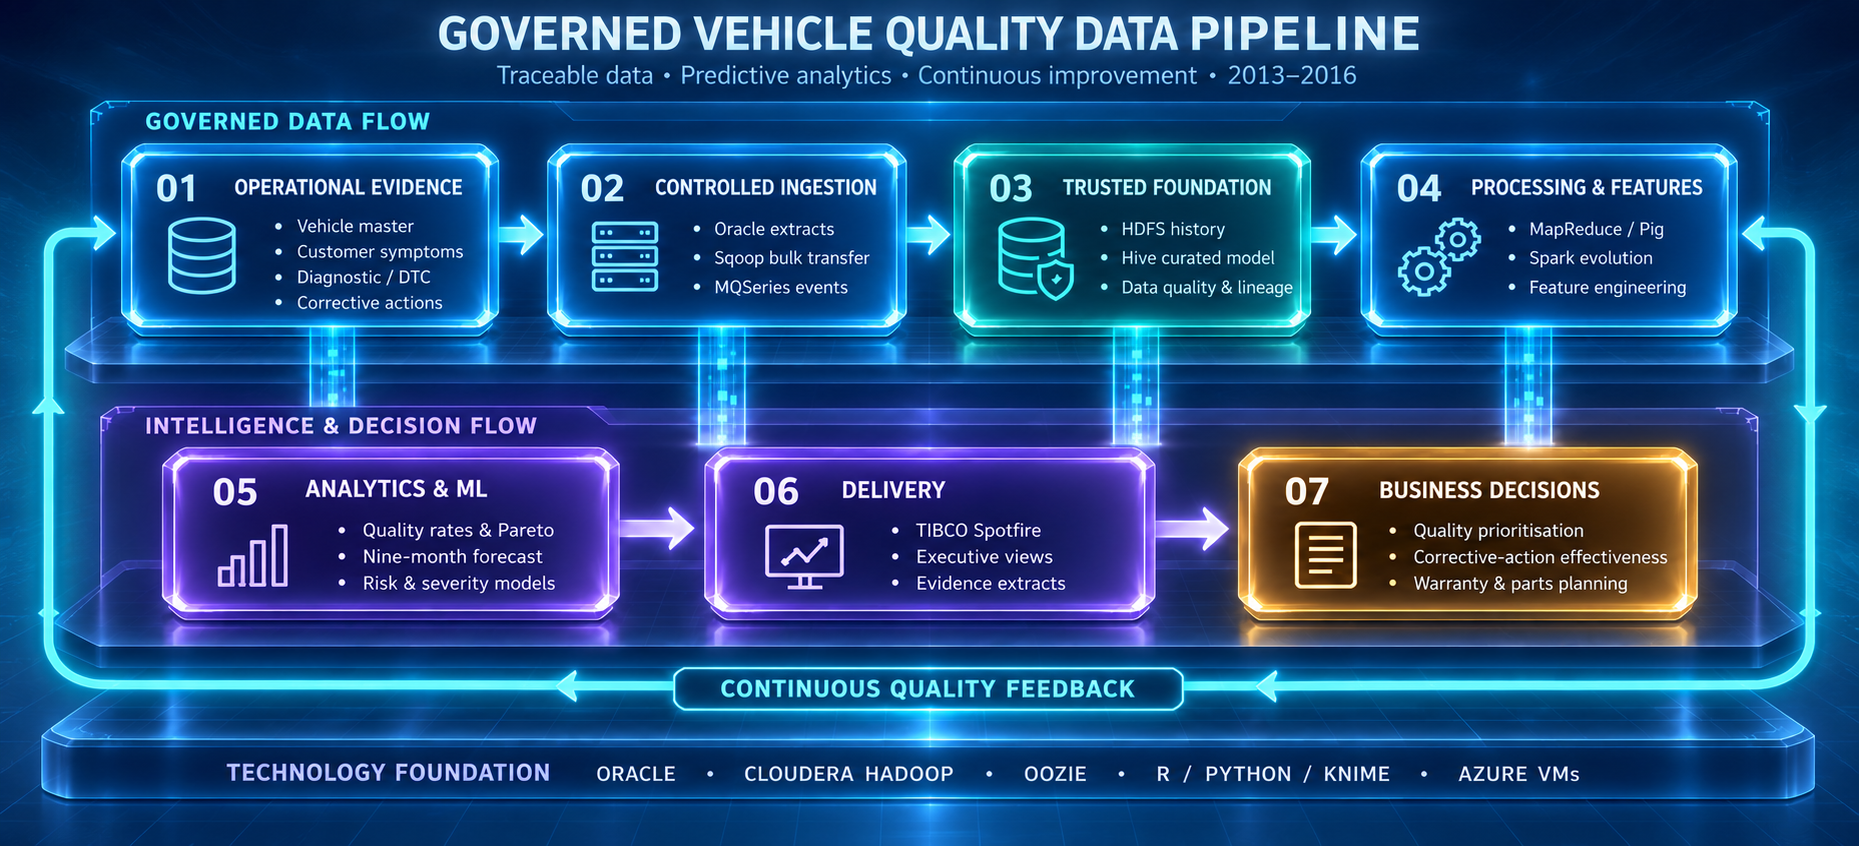
The governed pipeline connected operational evidence to controlled ingestion, a trusted data foundation, analytical processing and decision delivery—while preserving a continuous quality-feedback loop.

Governed Vehicle Quality Data Pipeline
Governed Vehicle Quality Data PipelineOperational evidence moves through controlled ingestion, trusted data,
processing and predictive analytics into quality, warranty and corrective-action decisions.
Operational evidenceControlled ingestionTrusted foundationProcessing & featuresAnalytics & MLDecision deliveryContinuous feedback
05 · OPERATING MODEL

Govern strategically. Deliver iteratively. Learn continuously.

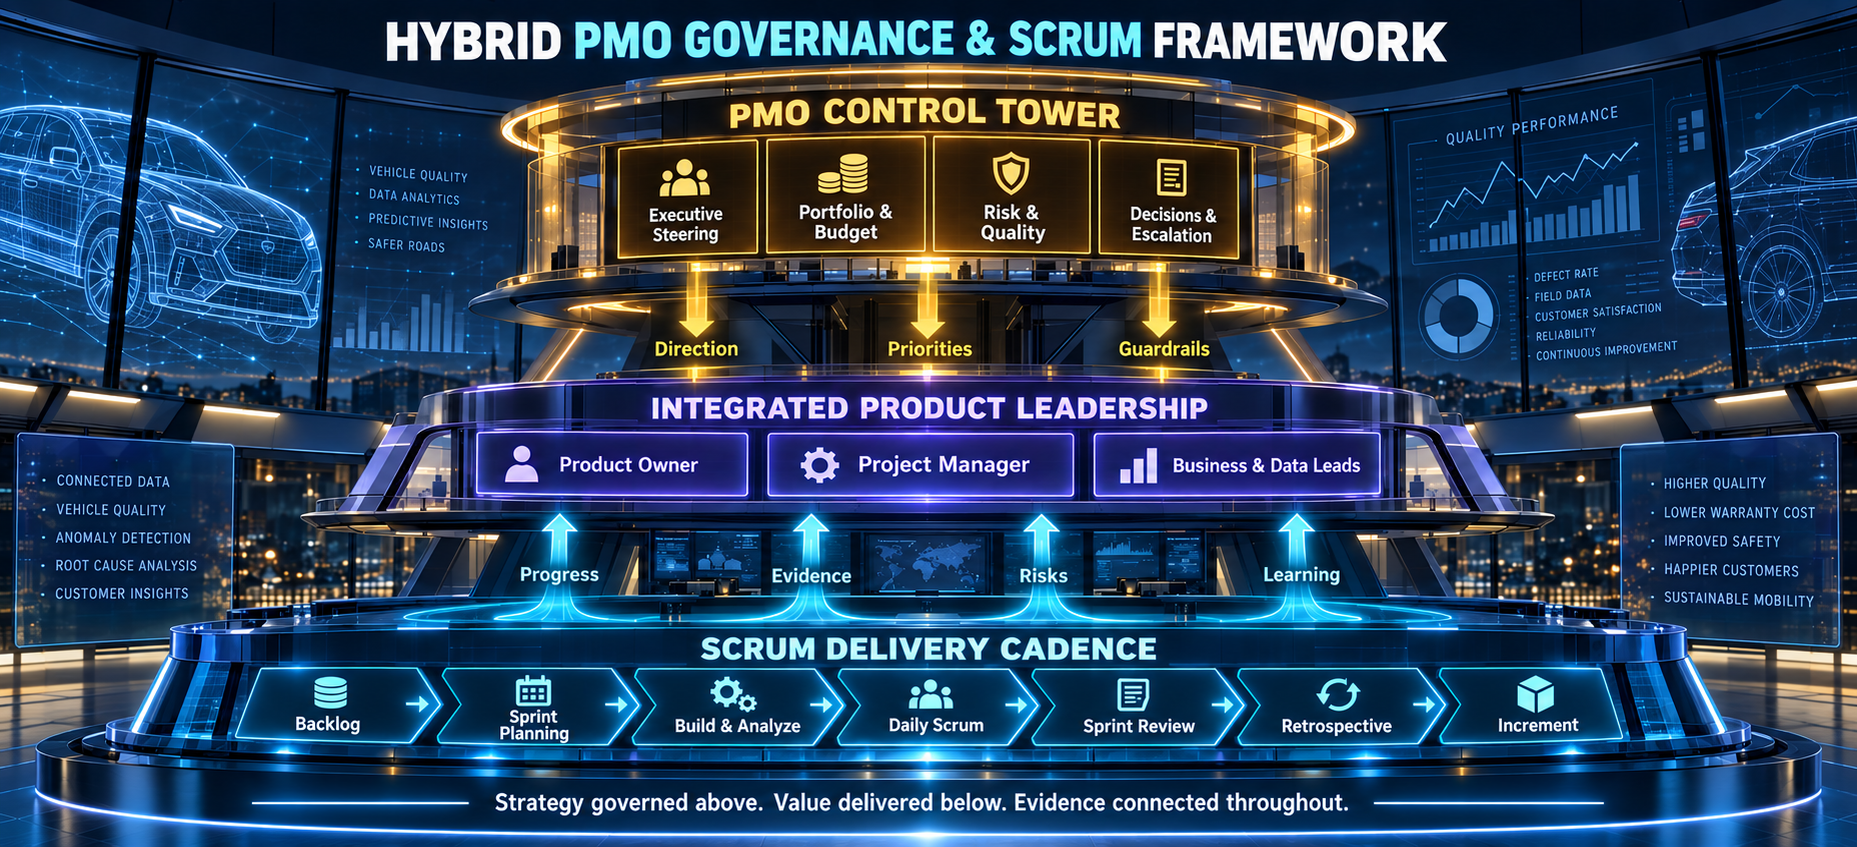
The delivery model combined PMO steering, portfolio priorities and quality guardrails with integrated product leadership and a disciplined Scrum delivery cadence.

Hybrid PMO Governance and Scrum Framework
Hybrid PMO Governance & Scrum FrameworkExecutive steering and decision guardrails governed the programme above, while integrated product leadership connected evidence, risks and learning to iterative Scrum delivery below.
Executive steeringPortfolio & budgetRisk & qualityProduct leadershipScrum cadenceContinuous learning
06 · DATA MODEL & GOVERNANCE

Govern the meaning before scaling the analytics.

A credible forecast required more than ingestion. It required shared definitions for fleet perimeters, symptom groupings, product contributors, diagnostic evidence and measurement dates.

Data-product architecture,
not dashboard assembly.

The work established controlled entities and relationships across vehicle populations, incidents, symptoms, diagnostic files, ECU attributes, defects, analytical treatments and corrective-action references. That semantic foundation made every downstream rate, Pareto and forecast interpretable.

ScopeFleet & perimeter definitions

Consistent populations, countries, products and measurement periods.

SemanticsSymptoms & diagnostics

Controlled grouping logic and traceable relationships.

QualityRules & reconciliation

Normalisation, completeness checks and governed calculations.

AccessRoles & controlled use

Enterprise access and fit-for-purpose operational views.

07 · PREDICTIVE ANALYTICS

Turn historical quality evidence into a forward-looking risk signal.

The analytical layer combined interpretable quality metrics with contribution analysis and a nine-month forecasting horizon—giving operational users a defensible route from trend detection to investigation.

01

Monitor symptom rates

Track quality signals across selected fleets and perimeters, compare current performance with target or commitment levels and identify meaningful deviations.

02

Prioritise contributors

Use product-contribution and diagnostic-code Pareto analysis to focus investigation on the components and defects explaining the largest share of exposure.

+9

Forecast the risk horizon

Extend monthly rate and product-mix evidence into a nine-month outlook designed to anticipate potential alerts and support earlier quality and warranty decisions.

08 · OPERATIONAL USER JOURNEY

From fleet selection to supporting evidence in six controlled steps.

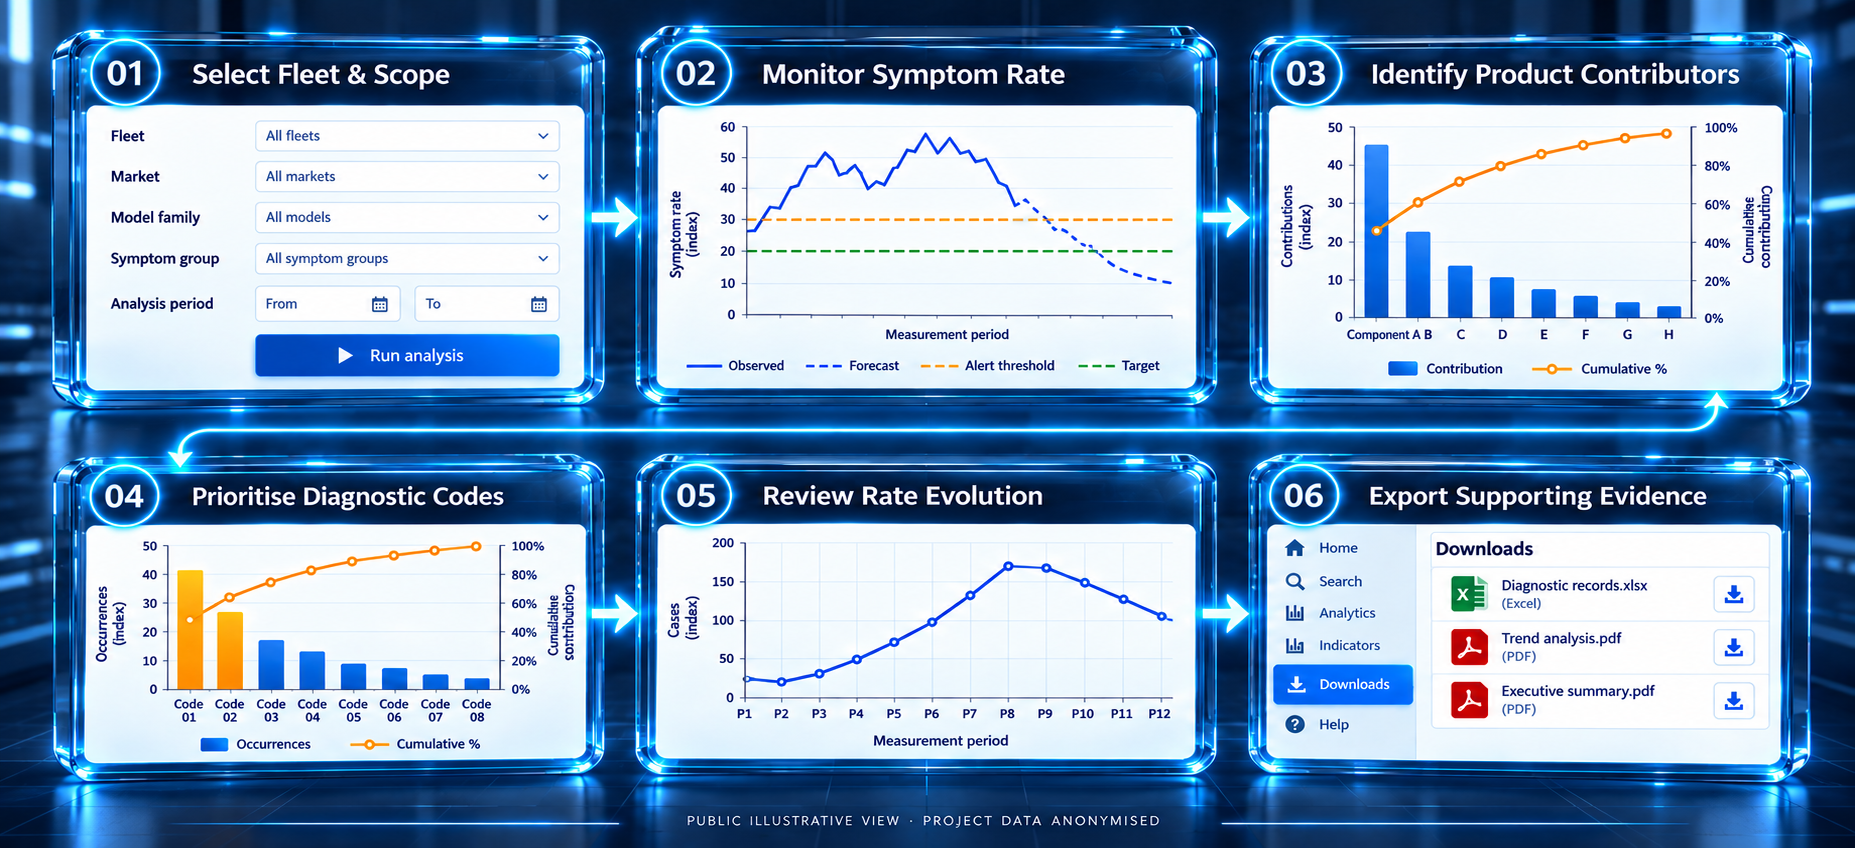
The product experience translated complex analytical treatments into a progressive drill-down journey. Public labels and data have been anonymised while preserving the interaction logic.

Public vehicle-quality analytics user journey
Vehicle Quality Analytics — Public User JourneySelect scope, monitor the symptom rate, identify contributors, prioritise diagnostic codes, review the trend and export supporting evidence.
Fleet scopeSymptom trendContributor ParetoDiagnostic ParetoRate evolutionEvidence export
09 · CORRECTIVE-ACTION LOOP

Close the loop between detection, evidence and action.

Quality intelligence created value only when the analytical signal could be investigated, linked to engineering evidence and compared before and after corrective action.

01Detect

Identify an abnormal fleet or symptom-rate signal.

02Prioritise

Rank product contributors and diagnostic codes.

03Investigate

Review trends and supporting diagnostic cases.

04Act

Connect quality evidence to corrective-action decisions.

05Measure

Compare the rate before and after the action frontier.

10 · EXECUTION EVIDENCE

Documented product logic from data model to user workflow.

The case is supported by requirements, workshop material, conceptual modelling and operational navigation artefacts. Confidential implementation detail and unsupported quantified claims remain excluded.

Product

Functional scope & workflows

Defined perimeters, roles, questions, drill-down sequences, comments, exports and decision interactions.

Data

Conceptual model & relationships

Structured vehicle, symptom, diagnostic, ECU, treatment and corrective-action entities.

Analytics

Rates · Pareto · forecast

Specified calculation logic, contributor analysis, diagnostic-code prioritisation and nine-month projections.

Delivery

Operational application design

Translated analytical logic into an enterprise workflow for quality and warranty decision support.

Disclosure rule: selected vehicle-quality, diagnostic, warranty and internal architecture details are withheld due to NDA, safety and enterprise confidentiality. Visuals are public conceptual reconstructions using anonymised content.
11 · BUSINESS OUTCOMES

Earlier visibility. Evidence-led prioritisation. Stronger warranty decisions.

The defensible outcome is the operating capability created: a governed predictive-quality product connecting cross-source evidence, forward-looking analysis and operational decision workflows.

Visibility

Earlier view of quality exposure

Fleet-level signals and future outlooks made emerging quality risks easier to identify and discuss.

Focus

Evidence-led defect prioritisation

Pareto analysis and drill-down paths concentrated attention on the most material contributors.

Decisions

Operational quality intelligence

Users could move from aggregate rates to diagnostic evidence and corrective-action context.

Planning

Warranty & parts decision support

The nine-month horizon strengthened the basis for proactive quality, warranty and parts-planning decisions.

Predictive AnalyticsData Product LeadershipVehicle Quality IntelligenceData GovernanceData ModellingData PipelinesBusiness IntelligenceOperational AnalyticsProduct OwnershipWarranty Risk Management
LEADERSHIP VALUE

Industrial analytics becomes valuable when evidence, prediction and action operate as one product.

This case demonstrates the ability to connect a fragmented industrial data landscape to a governed analytical model, an operational user journey and a forward-looking decision capability—without losing traceability or interpretability.

Data ProductEnd-to-end lifecycle
Artificial IntelligenceMachine Learning
AnalyticsPredictive + operational BI
GovernanceDefinitions + traceability
Business valueQuality + warranty decisions
Continue exploring

Return to all case studies.

Product · Data · AI · Governance · Transformation

→